MAF allows investors to participate in the Asian century with confidence while protecting against market crashes.
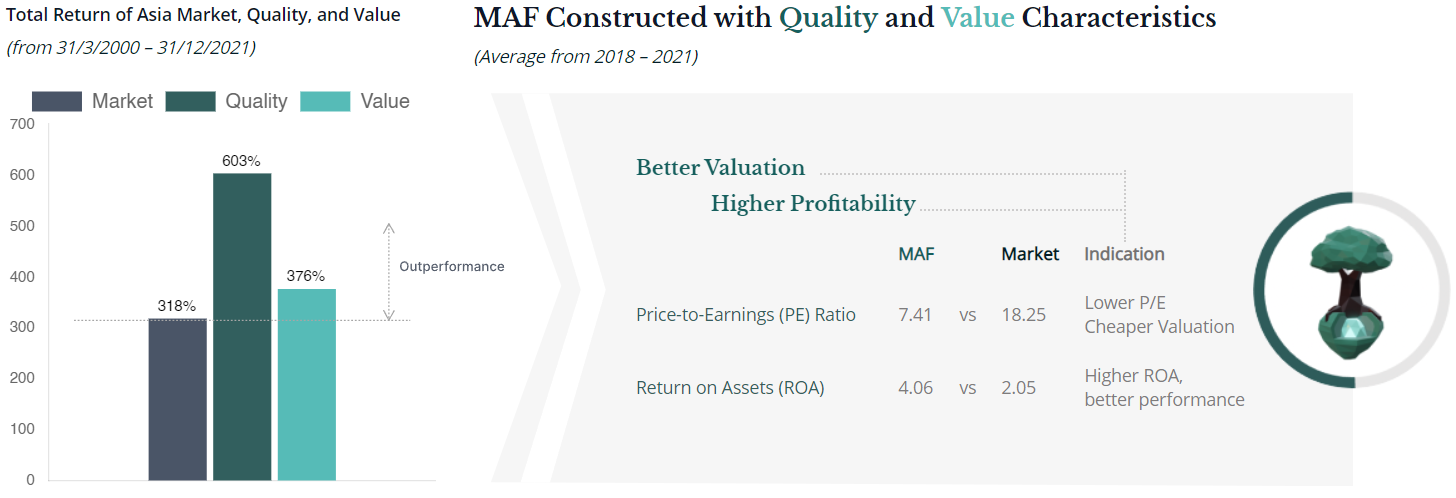
How do we know which companies have the potential to do well? Some investors base their decisions on a story or newspaper headlines. We prefer to be guided by facts rather than stories. Systematic analysis helps us to screen through the entire universe and find the hidden jewels. MAF investors get a portfolio with better profitability at a better valuation than index investors, allowing them to participate before the market recognises these opportunities.
(from 31/3/2000 – 31/12/2021)

| MAF | Market | Indication | ||
|---|---|---|---|---|
| Price-to-Earnings (PE) Ratio | 7.41 | vs | 18.25 | Lower P/E Cheaper Valuation |
| Return on Assets (ROA) | 4.06 | vs | 2.05 | Higher ROA, better performance |
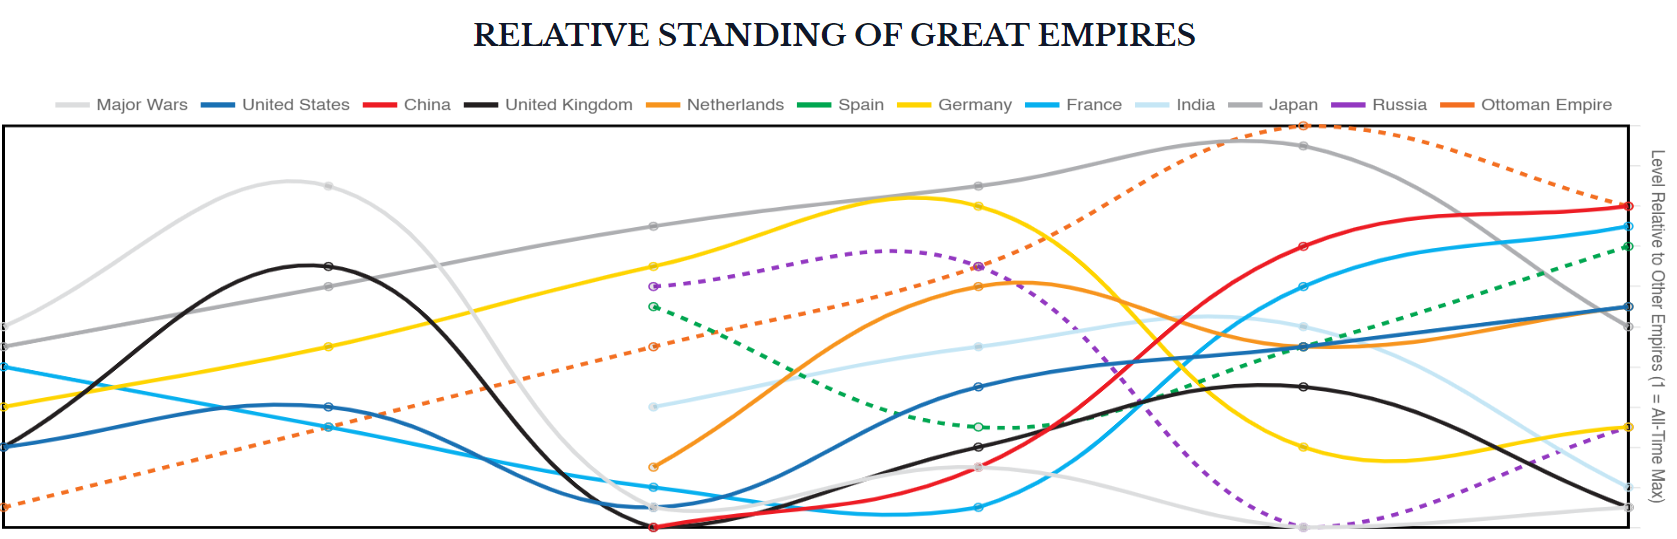
Markets take turns performing; investors need to have patience and plenty of confidence while investing in Asia. Even though we are already in the Asian Century, as Ray Dalio described in his book, the journey will not be smooth.
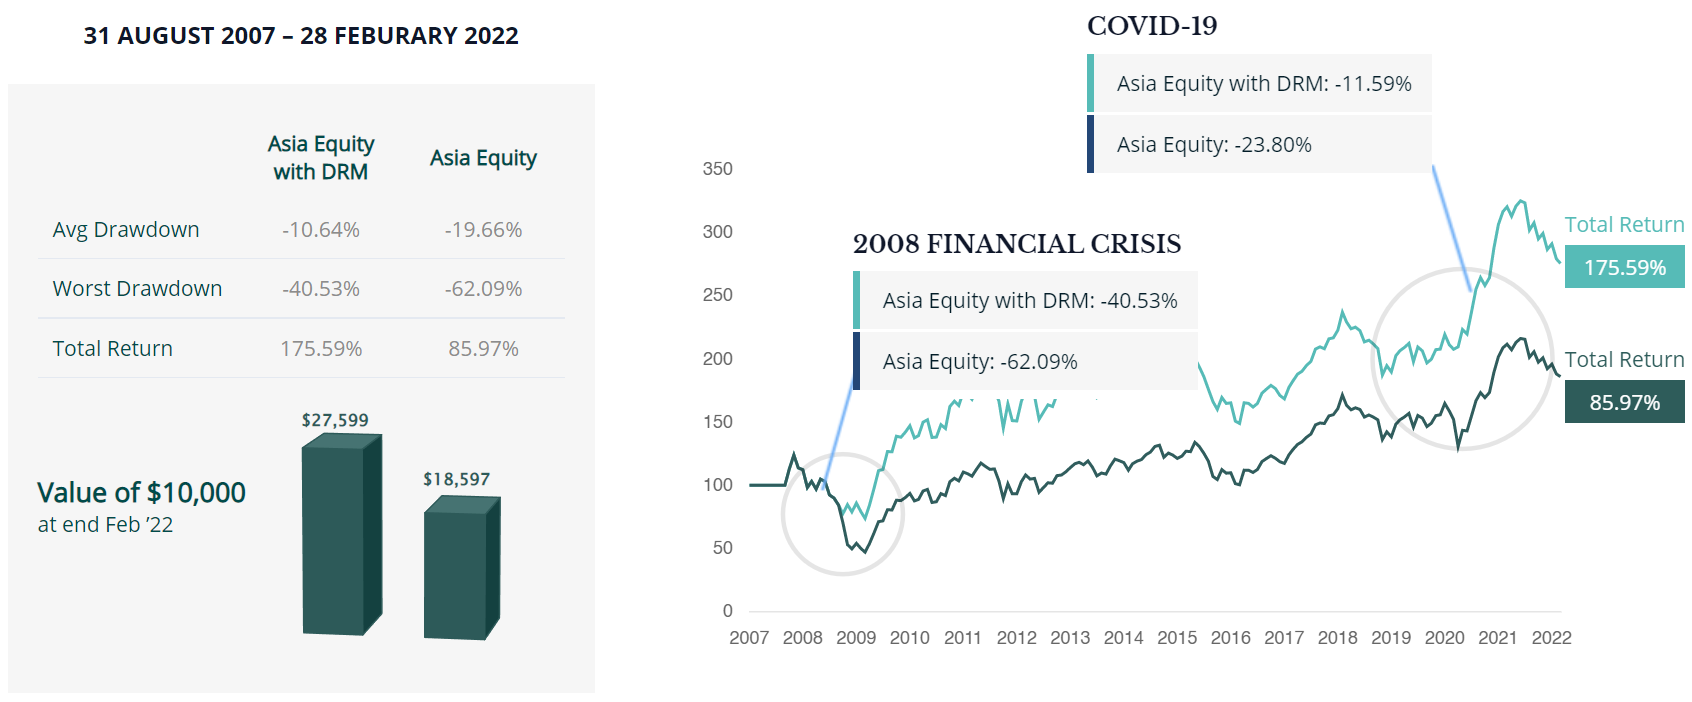
MAF is designed to allow one to enjoy Asia equity market return with confidence by avoiding:
1. Financial pain: Large losses lead to negative compounding. If you invested in Asia Ex Japan just before the 2008 GFC, you would have achieved an 86% total return (the worst can happen to anyone). With MAF, however, your return would be improved to 175%.
2. Psychological pain: The worst is not getting in just before a market crash; the worst is when investors cannot take the pain, invariably liquidating their investment, resulting in permanent capital loss.
| Asia Equity with DRM |
Asia Equity | |
|---|---|---|
| Avg Drawdown | -10.64% | -19.66% |
| Worst Drawdown | -40.53% | -62.09% |
| Total Return | 175.59% | 85.97% |

By entering this site you agree to be bound by the Terms and Conditions of Use. Finexis Asset Management Pte Ltd (“we” or “us”, ("FAM")) is a Capital Markets Services licence holder and regulated by the Monetary Authority of Singapore (‘MAS’).
By using this site you represent and warrant that you are an accredited investor or institutional investor as defined in the Singapore Securities and Futures Act (Chapter 289). In using this site users represent that they are an accredited and/or professional investor and use this site for their own information purposes only. https://sso.agc.gov.sg/Act/SFA2001
This site and the information included herein is for general information purposes only and does not constitute an offer or solicitation to subscribe in the funds or products referred herewith. This site does not constitute investment advice or counsel or solicitation for investment in any fund, products or services. The content of this website should not be regarded as investment advice or financial product advice and should not be relied upon as such. In making any investment decision, prospective investors must rely on their own examination of the merits and risks involved. The information contained in this document is subject to change without notice. It is not intended for public use or distribution. Any research or analysis used to derive, or in relation to, the information has been procured from sources deemed reliable by FAM for its own use, without taking into account the investment objectives, financial situation or particular needs of any specific investor. To the best of its knowledge and belief, FAM considers the information contained herein as accurate as at the date of publication.
The funds mentioned in this website are suitable for professional or institutional investors only. All investment involves risk and past performance is not indicative of future results. Our investment management services relate to a variety of investments, each of which can fluctuate in value. The value of funds and portfolios we manage may fall as well as rise, and the investor may not get back the full amount originally invested. The loss on realization or cancellation may be very high including total loss of investment, as the value of such an investment may fall suddenly and substantially. Any projections or forward-looking statements are not necessarily indicative of future or likely performance.
Any links to other websites contained within this website are for the convenience of the user only and do not constitute an endorsement by FAM of these websites. FAM is not responsible for the content of other websites referenced in this website.
Any offer or solicitation will be made only upon execution of completed information memorandum, subscription application and relevant documentation, all of which must be read in their entirety. No offer to subscribe in shares will be made or accepted prior to receipt by FAM of these documents and the completion of all appropriate documentation. Access to information about the funds is limited to investors who qualify as accredited investors only.
I have read and accept the terms and condition of use.